Bitcoin has been on a bull marathon since March’2020. Soon after the crash, price made a V-recovery & has been on a rise ever since. June & most part of July has shown record minimum volatility, with price testing 8.9K & making a slow rise soon after. Last Sunday saw the long awaited Blast-off to reclaim 10K. BTC hasn’t gone below 10K since then. Having faced resistance at 11.4K, BTC is slowly making its way up!
Now what’s next?
If you look closely at this below fractal from Jan to June’ 2016, you can see the similarities in the 2 fractals. This fractal led to the 2016 Halving. There was a 133 day long price recovery & consolidation before the Blast-off to 800$.
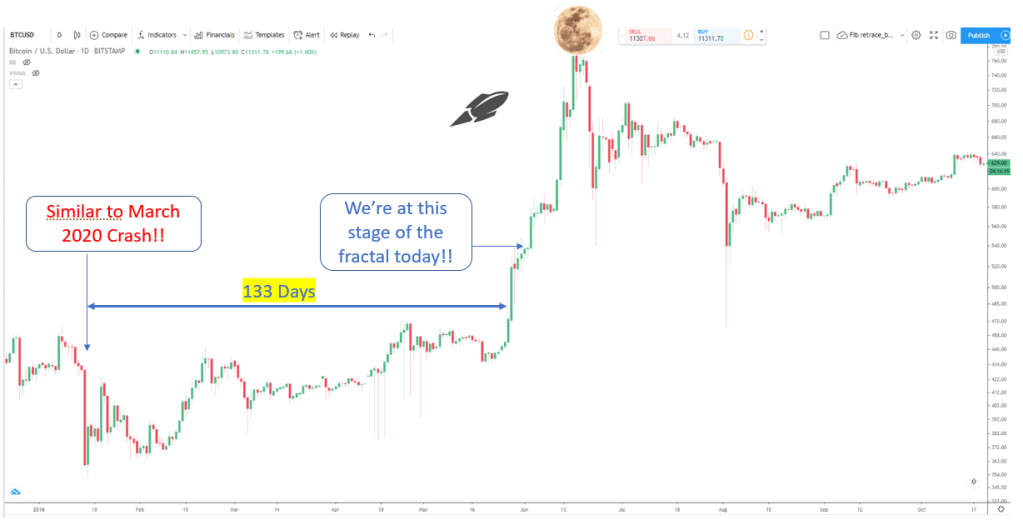
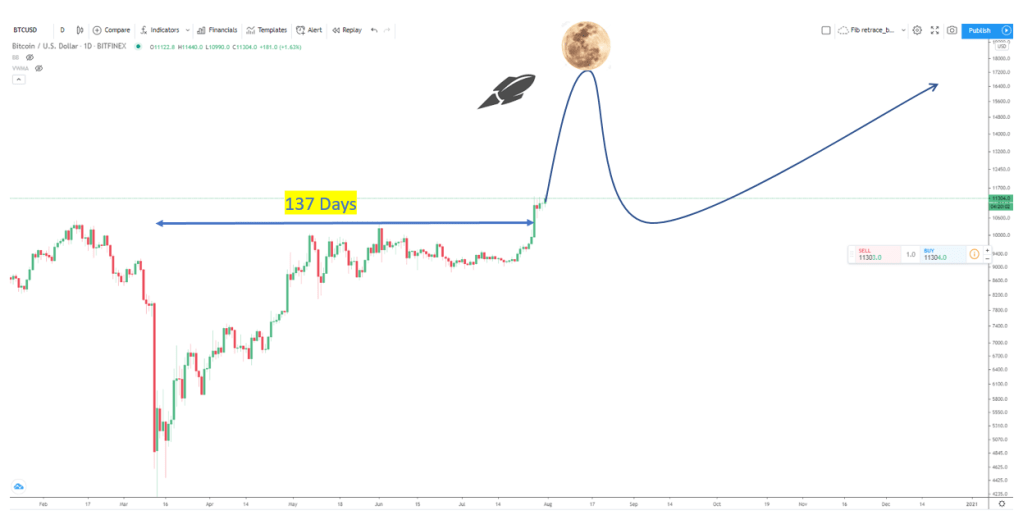
We are at a similar stage. Price has recovered & consolidated for 137 days before pumping to 11.4K this week. Next is the 2nd Leg of Blast-off to a “Price peak”. Going by the 2016 fractal, this “price peak” should be achieved within August. Price should drop thereafter then slowly grinding further up continuing the bull run.
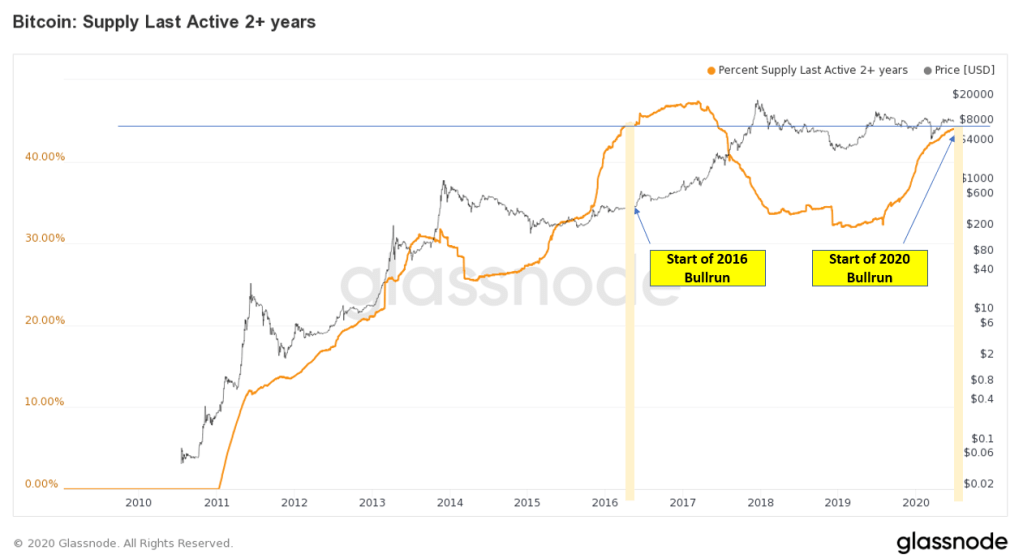
I know there will be many naysayers to this fractal. Below is an On-chain piece of data to validate this fractal. The 2 Yr+ HODL% currently is almost same as that just before 2016 Blast-off (May-June’2016). This further validates the 2016 fractal & flags off the 2020 Bullrun.
Now if you’re Bullish enough & believe me when I say that the price should peak within August , next question in your mind would be: How high will Bitcoin go before dropping again?
We will do a bit of Fundamental Data Analytics to reach the magic number. Yes, I’m talking about the August price peak. In the below chart, the red & green dots are the deflection of price from Stock-to-flow price. Deflection is the ratio of (Price / Stock -to- flow price). So deflection is < 1 if Price < S2F price and deflection is > 1 if Price > S2F price.
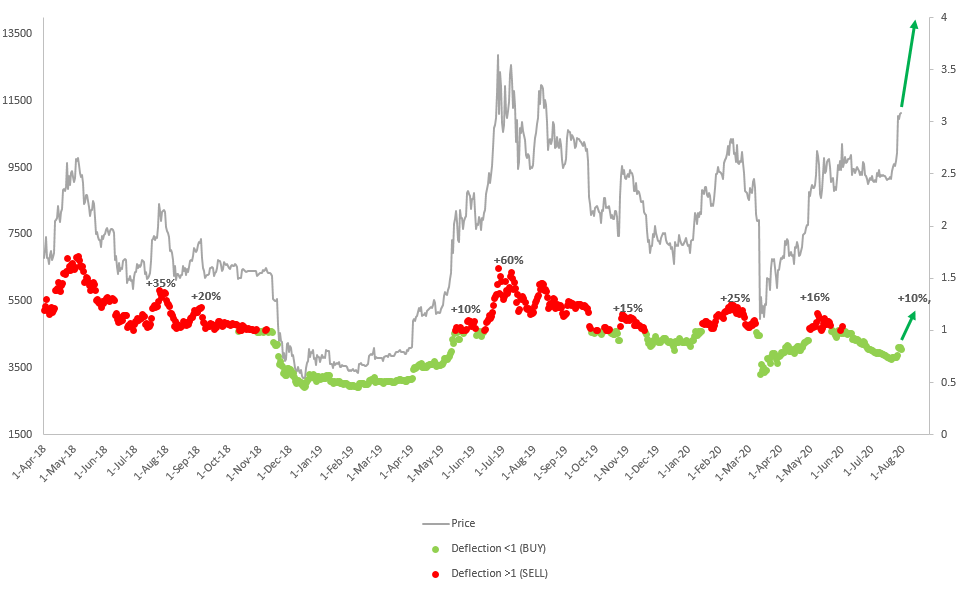
As you might observe, Deflection < 1 are points of price either bottoming or consolidating. When deflection < 1, price is “undervalued”, that is, as per the stock-to-flow price should ideally be higher but market has not priced the supply shock yet. These are excellent points to buy. When deflection > 1, price is “overvalued”. These are usually the points where price peaks, followed by deep pull-backs.
Currently, we are still at a “green” dot (deflection <1), that is, price is still undervalued, even at 11K. Deflection is moving up towards 1. Price will peak ONLY after it crosses over to >1 that is it gets from a green dot to red dot.
So next question is: where is the next red dot? If you look closely, you can see that for almost all red dots, deflection ranges between 10% to 60%, that is, when price peaks, BTC becomes overvalued in range of 10%- 60%. This means, atleast 10% overvalue is highly likely. Actual overvalue can be more than 10%, but it is safe to say we will see atleast 10% deflection.
Below picture contains the Stock to Flow prices in August that are already calculated as per Plan B’s Stock-to-flow model.
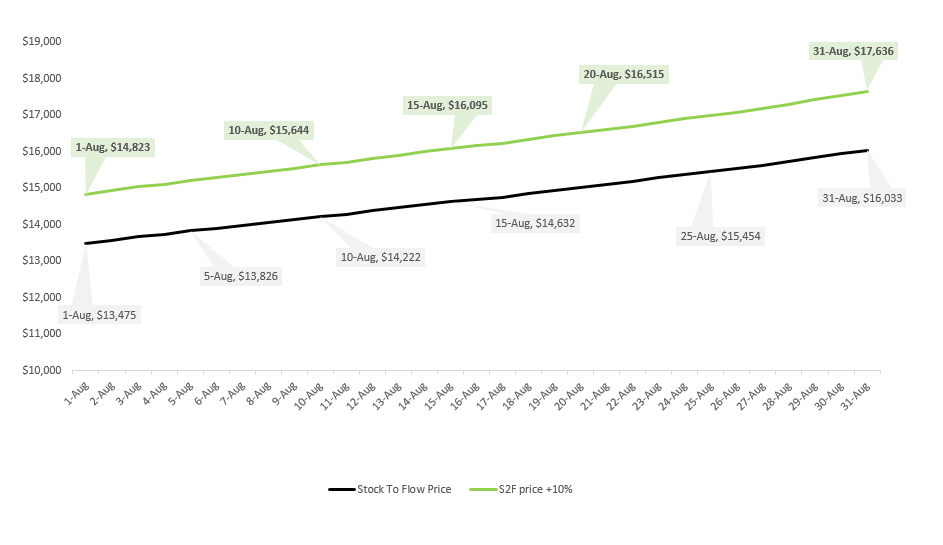
Now depending upon when the price Blast off takes place, if the blow-off top comes by 10th August, 15.6K is the minimum price for the top (Actual top can be more than this!). If blow-off euphoria comes on 15th August, minimum price for top is 16K.
If top comes by 31st August, price will peak atleast to 17.6K. So depending on when the top comes, we can estimate atleast till what price we need to HODL our coins.
In my view, 16K to 17K should be the price peak for August!!!
If you liked this analysis, please feel free to follow me on Twitter & WordPress. Like, retweet & FOLLOW!! Cheers!!

Looking forward to more such awesome invigorating insights from you and multiplying the money which I have invested!!!!
LikeLiked by 1 person
Happy to help pachkustockinger!
LikeLike
Omgggg😋😋😋
LikeLike