We have seen Bullish divergence in BTC Price action in this month. However I don’t consider this as the start of a major Bull run before the halvening. Reason? On- chain momentum doesn’t justify a major bull run in the near future. If anything, we are in the middle of a small rally within a greater bearish trend. I will share the techniques to analyze on-chain data later.
Here, we will look at how we can determine the top of this rally. We will use technical analysis to determine this. My favourite metric to do technical analysis is Fib Retracements. In my 4 years of BTC trading, I have seen that BTC likes to follow Fibs very religiously. So how to determine the top?
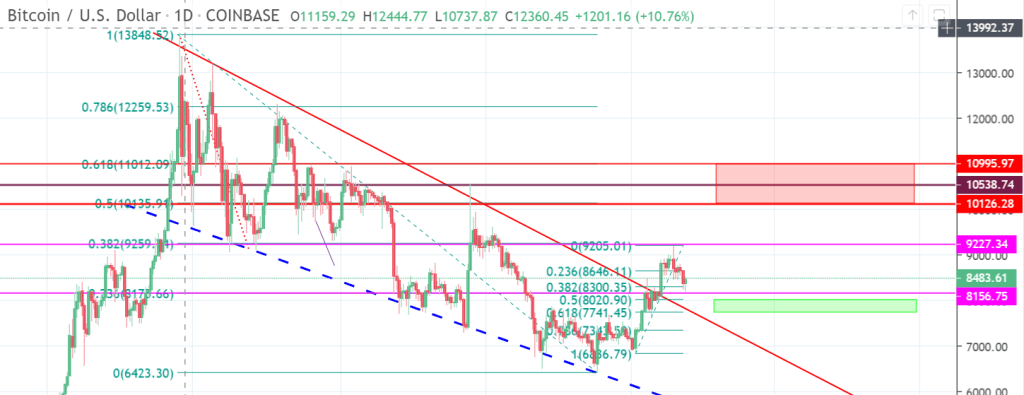
Simple. BTC will generally retrace upto 50% and in some cases upto 61.8%. We have the 0.5 fib for the long term dump from 13838$ to 6423$ at 10135$. 0.618 fib is at 11012$. So your sell zone should be $10135- $11012. I would bet on $11012 tbh, because after crossing 11k, many plebs will turn bullish and a huge amount of longs will get trapped. If we have daily close above 11K, this idea will get invalidated.
Where to buy? 7800$ to 8050$ is a good buy zone in my opinion, since these are the 0.5 and 0.618 fibs from 6836$ local bottom to 9205$ local top.
I think this idea will take atleast 3-4 weeks to play out. The buy zone should come towards end of January.

Fascinating! Love the impactful analysis
LikeLiked by 1 person
Thanks ! Hope you follow this idea and make bank
LikeLiked by 1 person